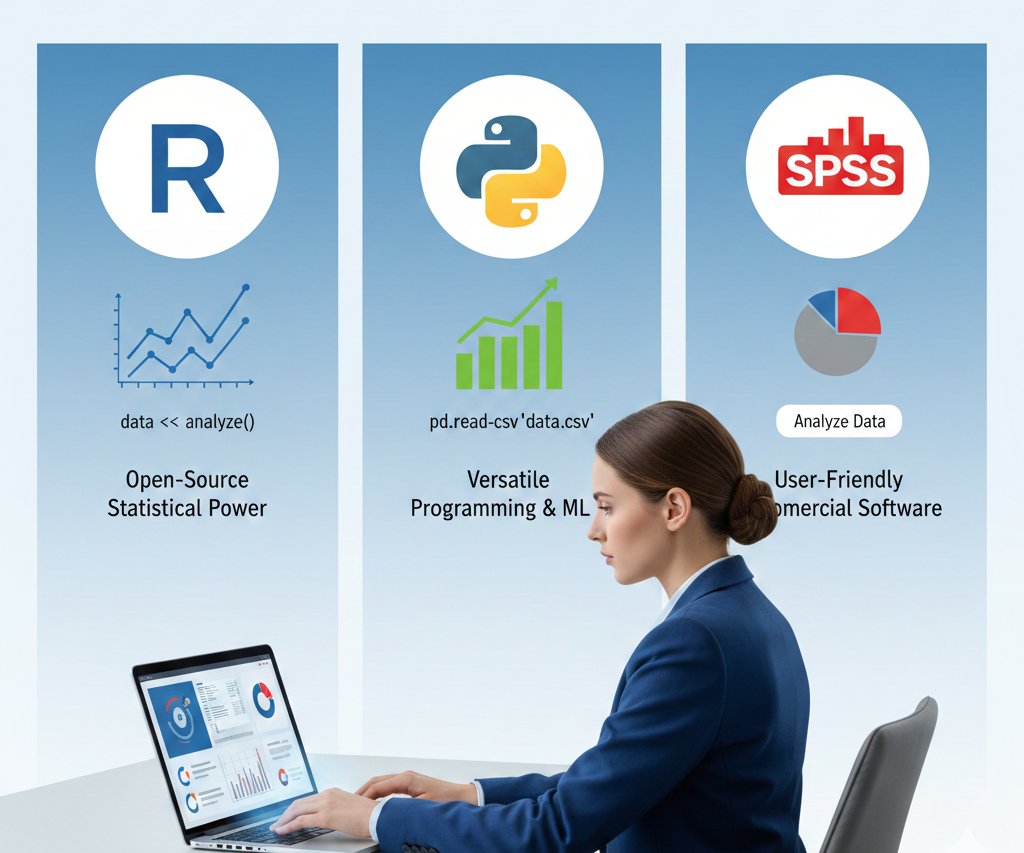
Being a research consultant, the efficiency and analytical capacity of your work and capability to produce meaningful results depend on your software toolkit. Not only is it a matter of taste, but also a matter of strategy; the proper selection of statistical software determines the costs of projects, the speed of delivery of deliverables, and the complexity of the models that we can implement. At Mars Publications, time is money, and there is no compromise on accuracy.
This manual cuts through all the clutter, pitting the three data analysis giants R, Python, and SPSS against each other to enable you to decide which statistical software will run your consulting business.
Python: The Corporate Workhorse
Python is the winner of consistency and scalability. Although not a statistical package per se, its ecosystem has quickly become a necessity of data science.
Strengths for Consultants:
The powerful Python libraries, especially scikit-learn, TensorFlow and PyTorch, provide you with the advantage in predictive modelling, classification and deep learning. This is essential when it comes to consultants addressing complex and current problems such as predicting customer churn or image/text analysis. You can easily embed Python models into client systems, web applications, or proprietary software. You can drag your analysis out of a static report into a live, real-time solution that is automated, making deployment smooth. Data scientists often use Pandas and NumPy to manipulate and clean large messy data, which is often a requirement in a consulting project. Notably, Python is open-source and free, and it does not have high costs of licenses, which is a considerable competitive advantage.
Weaknesses:
Python demands underpinnings in programming. Analysts accustomed to a graphical interface will require time to master it. As it increases in size, users usually regard its own statistical libraries (such as statsmodels) as inferior in niche academic statistical testing compared to R.
Mars Publications’ Take:
Use Python for big data development, develop machine learning applications, and incorporate your analysis into an enterprise IT system when required.
R: The Statistical Specialist
R is a language designed with statistical computing and graphics. It is still the favorite of statisticians and quantitative researchers across the world.
Strengths for Consultants:
R has an unrivaled collection of CRAN packages- more than 15, 000 – of almost every possible statistical method, including esoteric econometric models through the latest Bayesian methods. In case there is a statistical procedure, there is probably a package in R. ggplot2 is the standard of using graphics in the industry to produce beautiful graphics with a publication look. You also present high-quality visualizations that help explain complicated results to non-technical stakeholders. The code, the results and the text can be included in one document with the help of such tools as R Markdown which will help to produce the dynamic report (HTML, PDF, Word) which will ensure the reproducibility and will save enormous amounts of time. Similar to Python, R is free and open-source and thus extraordinarily cost effective.
Weaknesses:
R is not as general applicable and compatible with the large databases as Python. R may also be slower than Python, when working with really huge datasets since it tends to load the data frame into memory.
Mars Publications’ Take:
R applies when your project demands rigor, sophisticated hypothesis tests, or customized executive summary data visualization of high quality.
Statistical Package of the Social Sciences: The Workhorse
SPSS is the legacy of academic and social science research owned by IBM that is highly valued due to the ease of use.
Strengths for Consultants:
The Graphical User Interface (GUI) is very user friendly. It is good when the analyst needs to run complex tests (e.g., ANOVA, Regression) with a minimum amount of coding knowledge and thus it makes it simple and fast to run. Its data view, syntax, as well as output windows allow the task of rapid data inspection and analysis of results with ease. The education curve is low. New analysts are able to become useful sooner than with R or Python.
Weaknesses:
The SPSS is based on a costly proprietary license. This expense is also increasing exponentially as you hire more people or expand a bit larger. You are restricted to the functions that are coded into the software. It is sometimes impossible or highly complicated to apply custom, state-of-the-art algorithms or sophisticated machine learning. It struggles with big data. The graphical interface is cumbersome and time consuming dealing with millions of rows.
Mars Publications’ Take:
Use SPSS when you are in need of rapid standard descriptive statistics or when you have a small dataset and the analysts are not full-time programmers.
Conclusion: Selecting Your Strategy Tool
A consultant should have the best tool that has the least costs with the highest analytical power and speed.
In the case of a proactive research consultancy such as Mars Publications, R and Python have the long-term strategic benefit. They provide the highest level of flexibility, the most recent practices and zero licensing fees- a winning formula to create the highest value to clients. R is better at statistical richness and visualization whereas Python takes the lead in machine learning and enterprise application. We also advise our consultants to be conversant in both in order to settle in the appropriate tool to the particular client challenge.
Are you willing to raise your analytics? Select the one that matches your ambition. Mars Publications Contact us to see how our data science knowledge can change your next consulting project.